Experiments in Projected Strain Imaging
Our first bit of strain analysis, this time against a quantitative theory of strain around precipitates in a crystalline solid, can be found here. A second analysis, of strain in a 2D line drawing of an icosahedral cluster of fcc twins projected down the 5-fold direction, and a third analysis, of purely experimental HREM data from a GaN/sapphire film grown by molecular beam epitaxy, are shown below.Icosahedral Twins
2D (line only) sketch of a 20 fcc-crystal icosahedral twin cluster (more on experimental images of such beasts can be found here)
projected down it's 5-fold symmetry axis, along with it's power spectrum and
a 32x32 darkfield decomposition amplitude map.

Complex color darkfield (amplitude/phase) maps of a (200) "bowtie" (top) and a (111)
"butterfly" (bottom), with corresponding complex color strain (magnitude/direction)
maps to the right. The lower right panel shows the partly compressional, partly
tensional, strain
between two bowties due to the 70.5 degree fcc misfit with respect to the 72 degree
icosahedral symmetry of the cluster.

GaN/sapphire
These are our first results from the GaN/sapphire interface
region. Subsequent results, on the Ga-In transition layer further
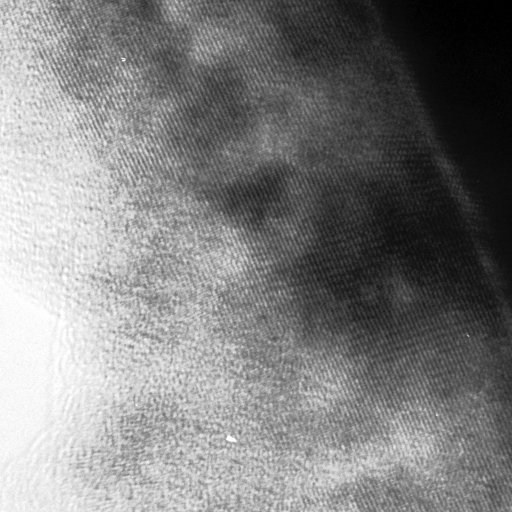
up in the film, will be added later. Here is a reduced resolution version of the (1 kibipixel)^2 = 1 mebipixel clip of
a GaN/sapphire image .
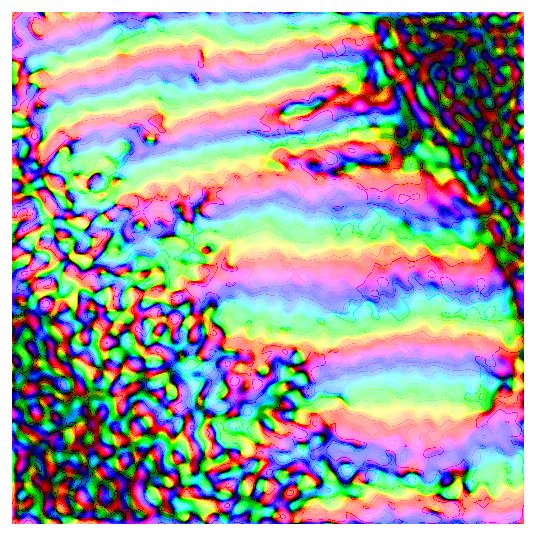
Here is a logarithmic complex-color darkfield image on the GaN (003) planes running parallel to the GaN/Sapphire Interface.
Resulting Log Reciprocal-Amplitude Directional Complex-Color Strain Images
for the (003) periodicity.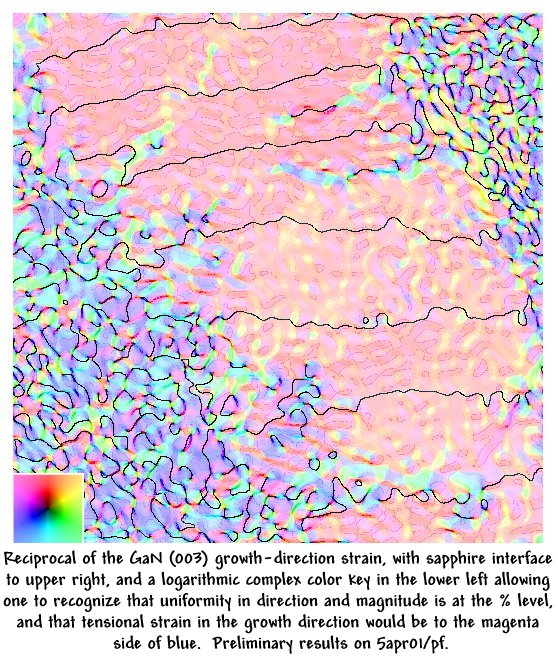
Logarithmic Complex-Color Darkfield Images with the (h00) planes running perpendicular to the GaN/Sapphire Interface.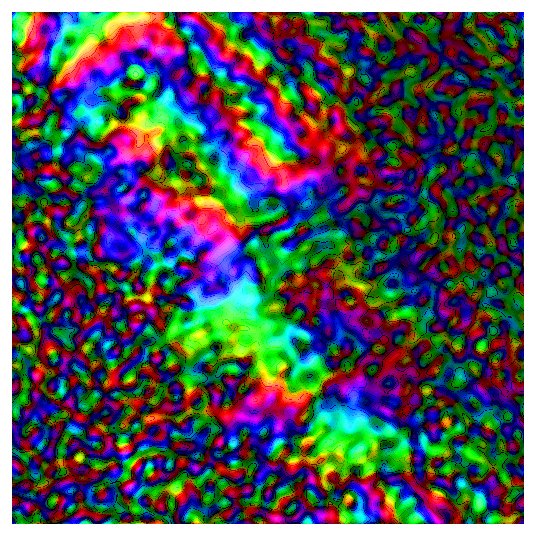
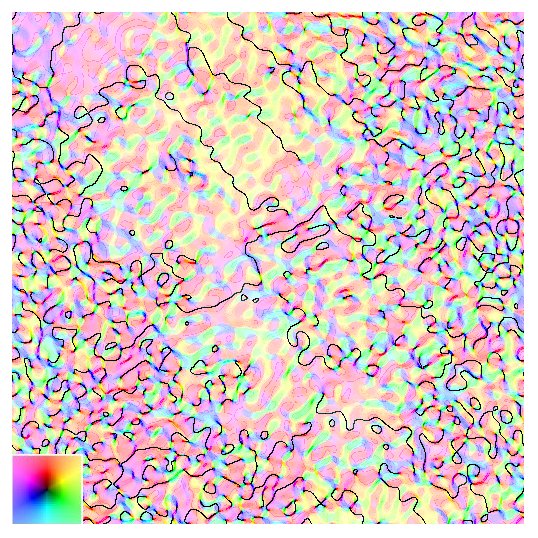
Resulting Log Reciprocal-Amplitude Directional Complex-Color Strain Images
of the (h00) periodicity.