Here the electric field vectors around two point charges (calculated using Coulomb's Law from Chapter 23) are plotted at points on a cartesian grid. Note that the field vector is evaluated at the arrow's tail point, so that in some cases the vector tip is quite far away from the point at which the field was evaluated.

Note: We also offer links to interactive models of electric fields associated with charge buildup on a capacitor and the voltage drop across a resistor.
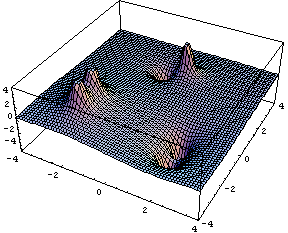
Here the potential (relative to infinity) is calculated using Sum[kQi/ri] from Chapter 25.

Such potential maps can also be displayed as grey value images, like the one below.

Assume that the arrows show the magnetic field vector on a three-dimensional cartesian grid, evaluated (using Biot-Savart from Chapter 30) at the tail point of each arrow. The first example is a straight wire running in the vertical (z) direction, the second is a current loop lying in the horizontal (xy) plane, and the third is a vertical two-turn solenoid. Note: We also offer an interactive model of magnetic field associated with the self-inductance of a solenoid.


